- Main Page
- What Colorblindness Is
- Frustrations / Dangers
- How Colorblindness Works
- Clinical Information
- Ishihara Test for Color Blindness
- Another Test for Color
- Shareware software for the color blind
- About the Color Charts
- Basic Black/Grays
- Basic Blues
- Basic Browns
- Basic Greens
- Basic Oranges
- Basic Purples
- Basic Reds
- Basic Off-Whites
- Basic Yellows
- Universal Color Chart
- Links to other Sites about Color Deficiency
- Colorblind Friendly Websites
Ishihara Test
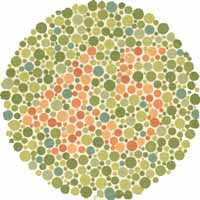
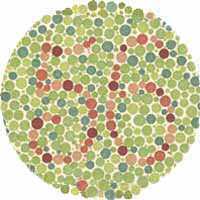
What numbers do you see revealed in the patterns of dots below?
| I am color blind, as is about 12 – 20 percent (depending on whose figures you want to believe) of the white, male population (I don’t have the figures for other racial profiles) and a tiny fraction of the female population. Most of the circles to the right are nothing but spots to me. Below are the correct answers to what a person with normal color vision would see – and what I see (and most people with Red-Green color blindness). With red-green color blindness, this is something a relatively large portion of the population lives with on a daily basis. Feel free to use colored printer ink to print these tests for use with your family and friends. When you understand what we can’t see, you may understand why it’s so tough to find the right sox and why we like bright colors, which are often identifiable. The full Ishihara test consists of a set of 38 plates and tests in-depth for color blindness. The plates here are a small representative sample of the whole, but will help spot the most common forms of colorblindness. Depending on the color balancing of your monitor, the tests may be somewhat more or less effective (e.g. if your monitor is not rendering the proper colors). | 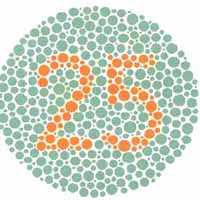 | 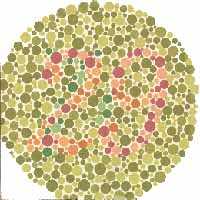 |
 |  | |
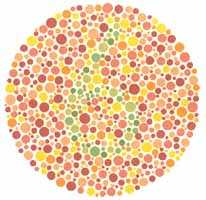 | 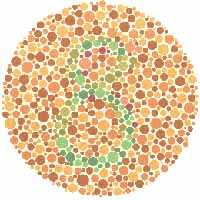 |
Results For Ishihara Test(above) | |||||
Normal Color Vision | Red-Green Color Blind | ||||
| Left | Right | Left | Right | ||
| Top | 25 | 29 | Top | 25 | Spots |
| Middle | 45 | 56 | Middle | Spots | 56 |
| Bottom | 6 | 8 | Bottom | Spots | Spots |


